Edmonton was the first Canadian city to create a detailed list of its infrastructure assets. This list helps evaluate the state and condition of Edmonton's vast network of roads, bridges, recreation centres, libraries, and other assets. These assets serve the growing needs of Edmonton's population, now and in the future.
The City of Edmonton (City) completes an annual inventory of its municipal assets. Read the most recent Infrastructure Inventory Report to see how the City manages and tracks its assets.
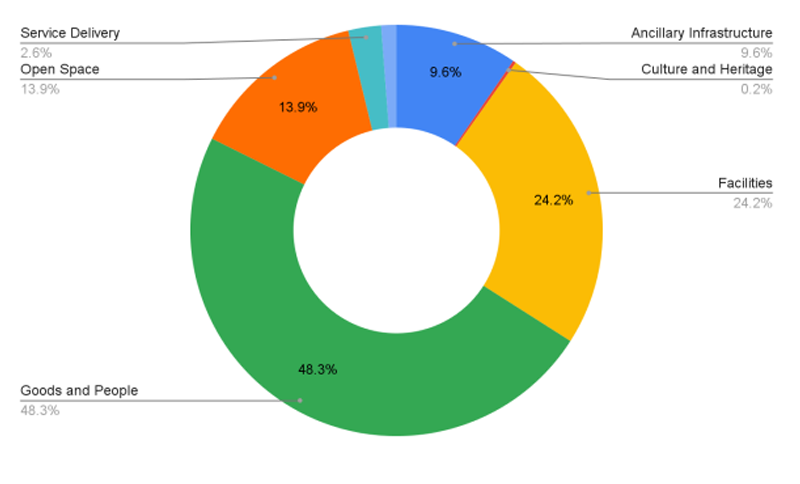
All City departments provide data on their assets to assess municipal infrastructure. The data is evaluated based on the asset's age, value, and condition. Asset management tools are used to analyze the data. These tools help determine the level of investment needed to keep City assets in good condition. Using these tools, the City can reduce the number of assets in poor or very poor condition.
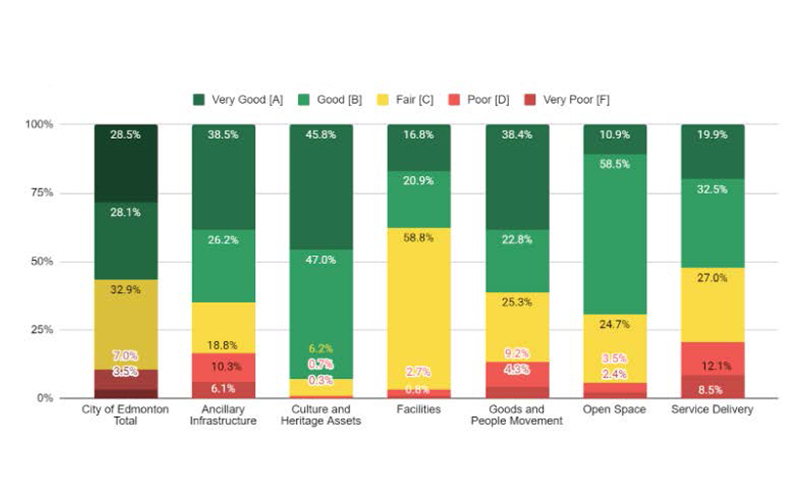
A 5-point rating system (A-very good, B-good, C-fair, D-poor and F-very poor) provides a high-level perspective of the state and condition of the City’s infrastructure. Infrastructure with a poor or very poor rating does not perform its designed function and does not meet program and service delivery needs.
Evaluation Criteria
Replacement Value: Provides an estimated cost for the City to replace an existing asset with a newer and equal asset. The replacement value is used for estimating the assets' dollar value for various purposes.
Expected Asset Life: As assets age, reinvestment is needed to ensure they meet their intended purpose. Different types of assets age at different rates and have different life expectancies. For example, drainage assets can last for 75 years, but a road asset would not last that long without reinvestment.
Condition: The City currently evaluates the condition of assets based solely on the physical condition and how an asset’s condition allows it to meet the intended service level. In addition to these standards, two additional measures are in development to address the dynamic needs of Edmonton’s infrastructure:
- Demand/Capacity: The capacity of the physical infrastructure and its ability to meet the service need
- Functionality: The ability of the physical infrastructure to meet program delivery needs